

Get to know me!
Together, let's unravel the tales concealed within the numbers, crafting narratives that inform, inspire, and drive meaningful change. 🚀
A Data Enthusiast, Unveiling Data Stories with Excel, SQL, Power BI and Python


Together, let's unravel the tales concealed within the numbers, crafting narratives that inform, inspire, and drive meaningful change. 🚀
Conducted comprehensive Customer Churn analysis for an e-commerce brand using EDA and statistical analysis (Spearman, Cramér’s V correlation tests) to identify key churn factors, and visualized insights with Python libraries (Pandas, NumPy, Matplotlib, Seaborn, Scikit-learn) to drive strategies for reducing churn and boosting customer growth. Developed RFM and K-Means segmentation models to target at-risk customers effectively, optimizing marketing efforts and enhancing customer retention
My work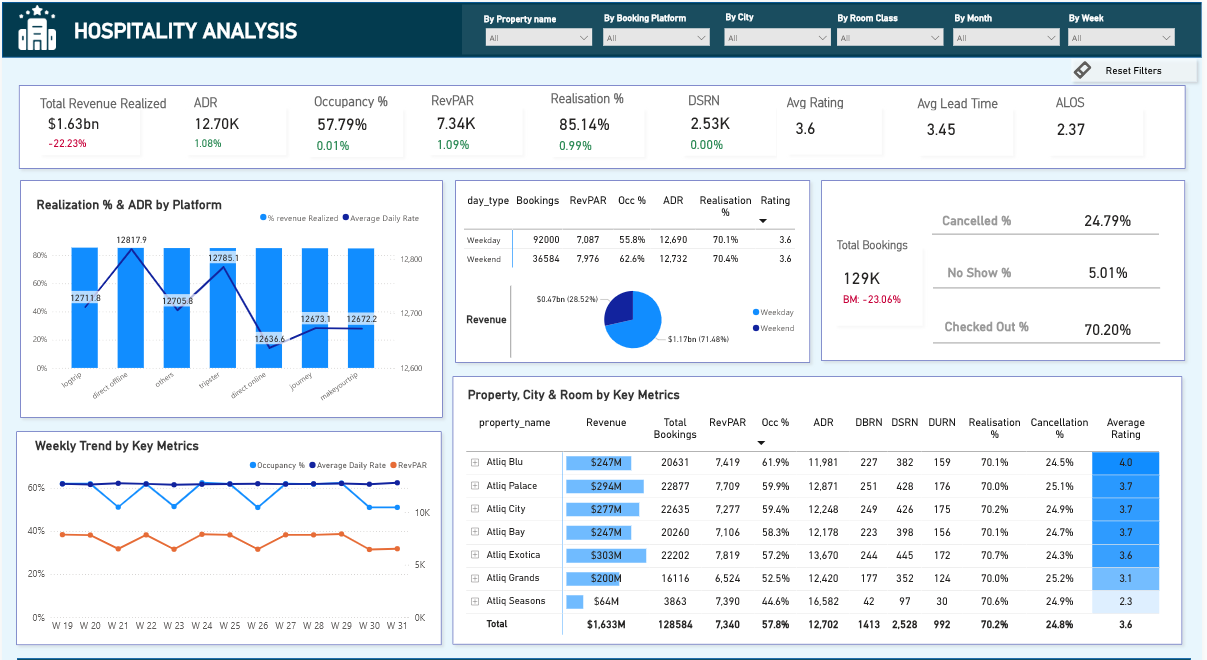
AtliQ Grands owns multiple five-star hotels across India. They have been in the hospitality industry for the past 20 years but now they are losing their market share and revenue in the luxury/business hotels category. So, I built a Power BI dashboard using data from Excel.This dashboard provides actionable insights to the Revenue Management Team of AtliQ hotels, featuring KPIs like Revenue, ADR, RevPAR, Occupancy, Lead time, Rating, DSRN etc and their trend WOW.
My work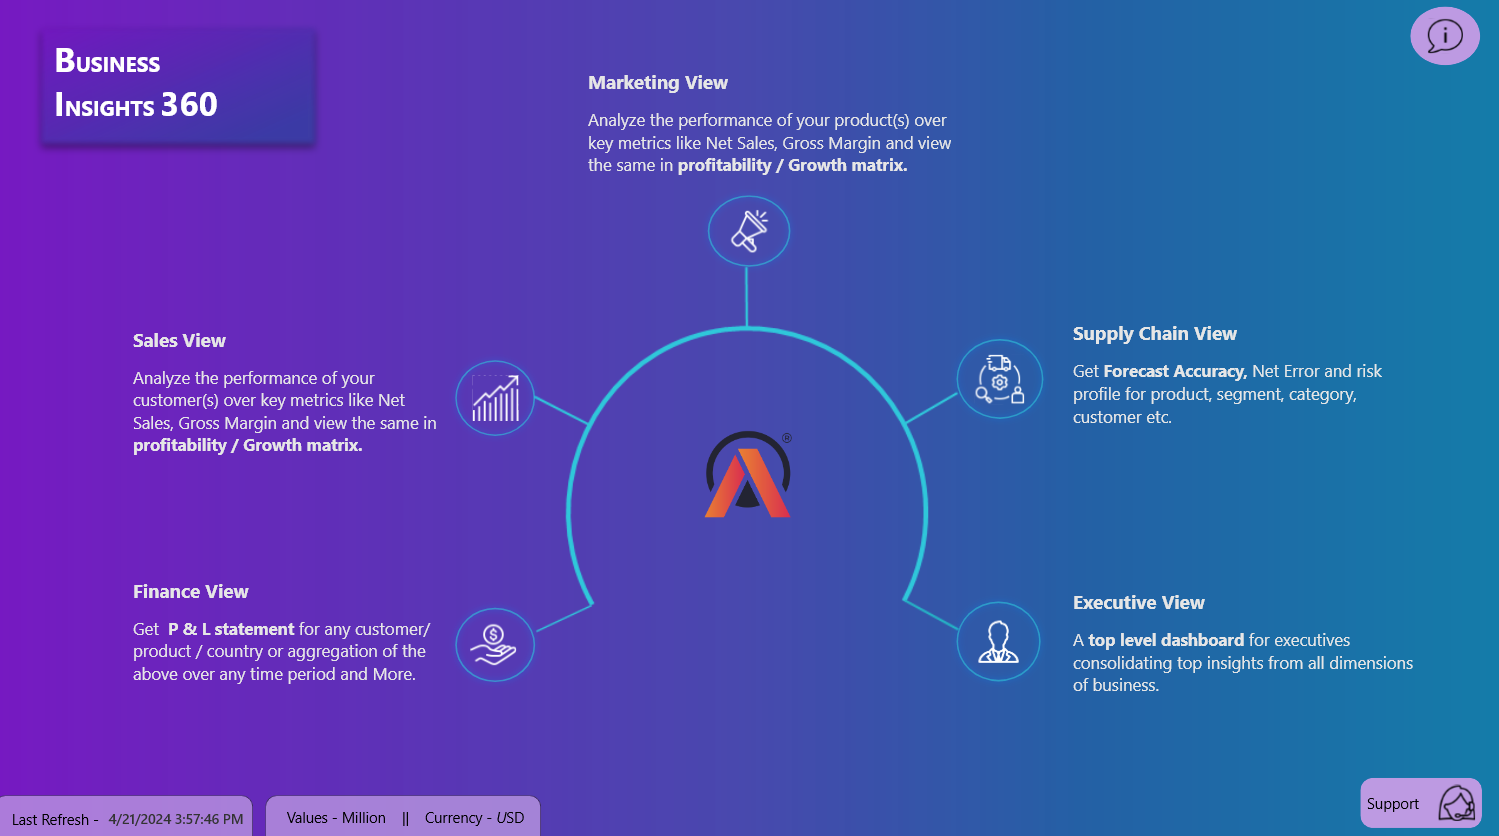
AtliQ Hardware struggled with major losses due to reliance on Excel reports. So, I built a Power BI dashboard using data sources from SQL and Excel. Tthis dashboard provides actionable insights across Finance, Sales, Marketing, Supply Chain, and Executive functions, featuring key performance indicators, helping them make data-driven decisions and target a 10% increase in profits.
My work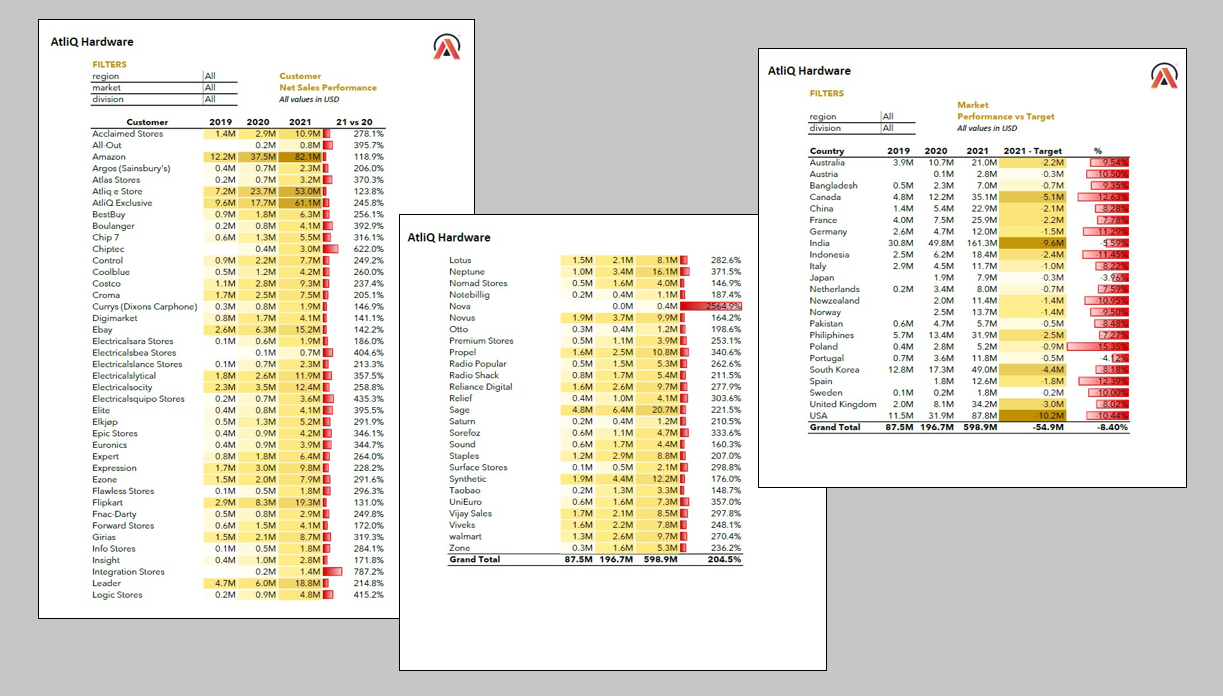
Designed Excel reports for AtliQ Hardware sales team to help them evaluate customer performance and understand their market performance with respect to their target. Also developed profit and loss reports categorized by years, quarters and markets to provide comprehensive insights into the financial performance of the business, enabling informed decision-making and strategic planning tailored to each market.
My work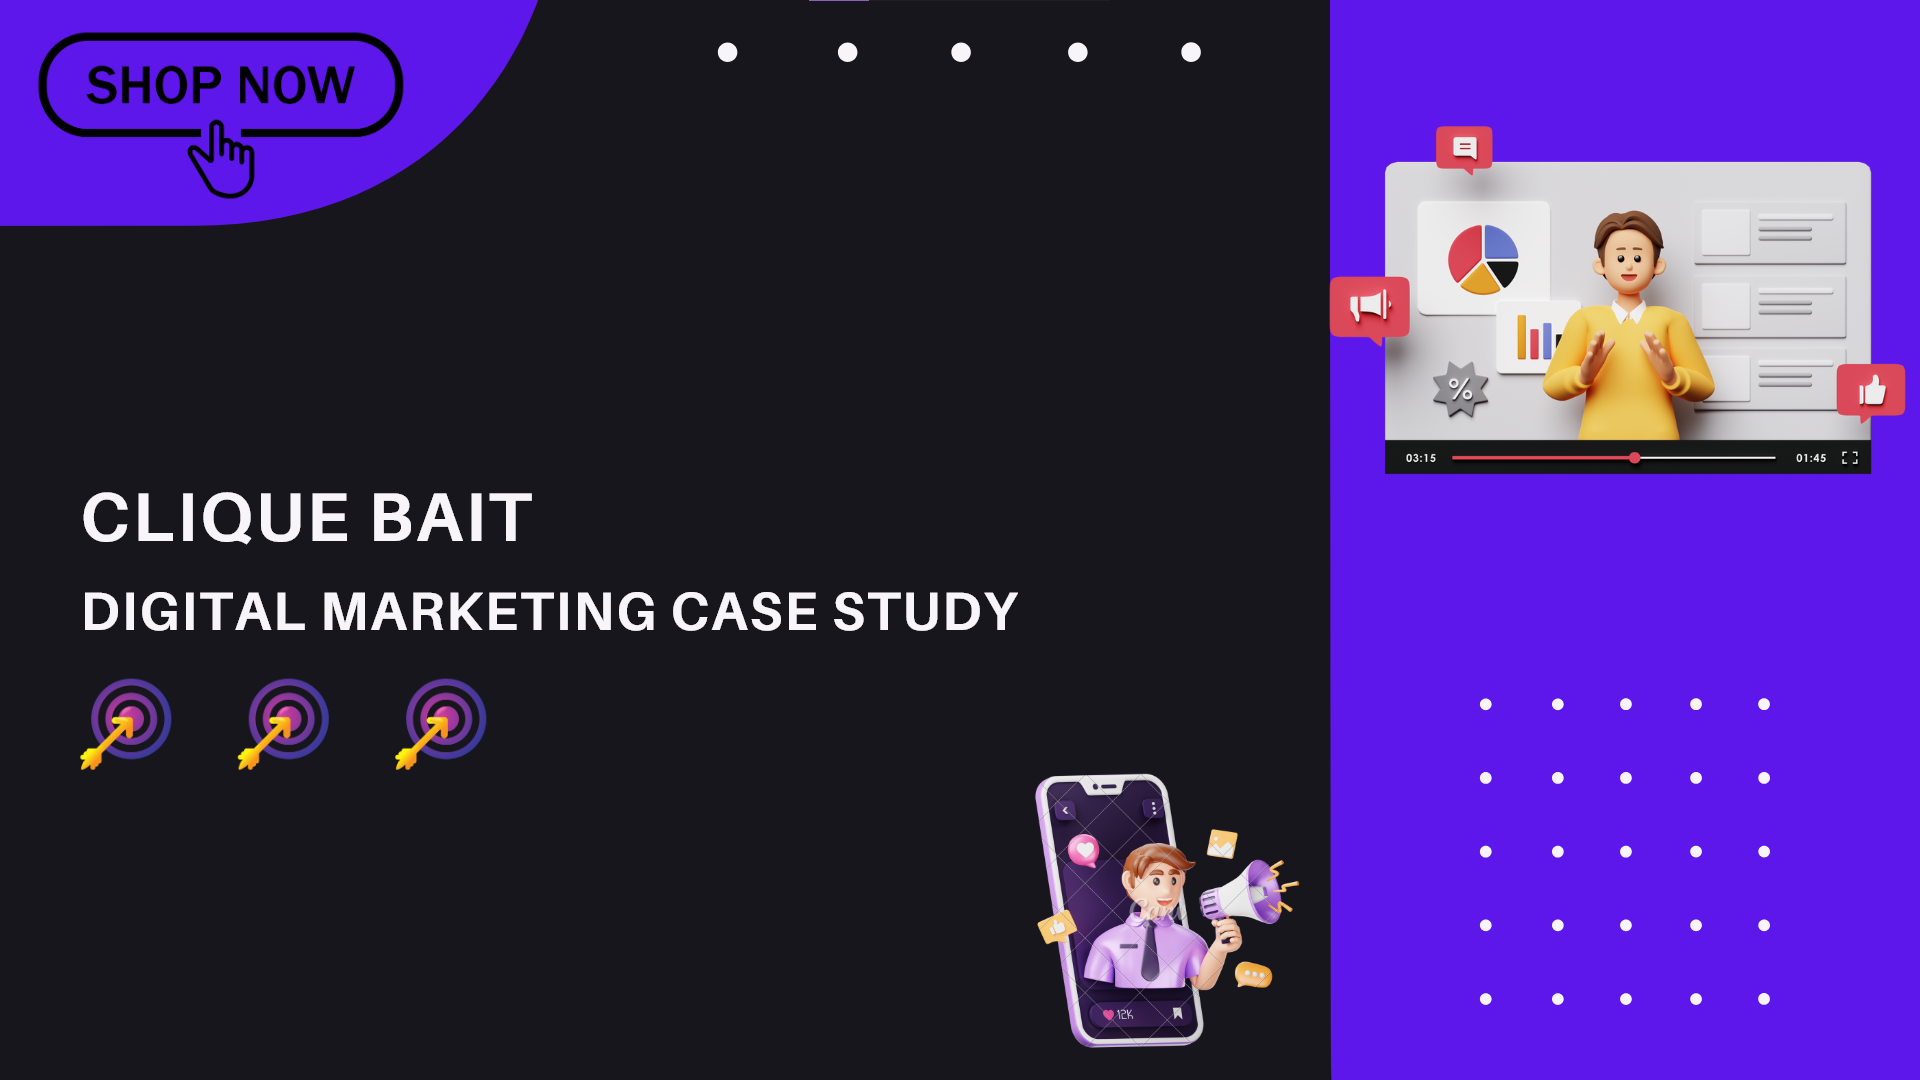
Conducted Digital, Product Funnel and Campaign analysis using SQL to investigate the funnel drop-off rates of an Online Seafood Store, allowing us to understand patterns in product views and conversions, assess campaign effectiveness in engaging users, and ultimately driving purchases.
My work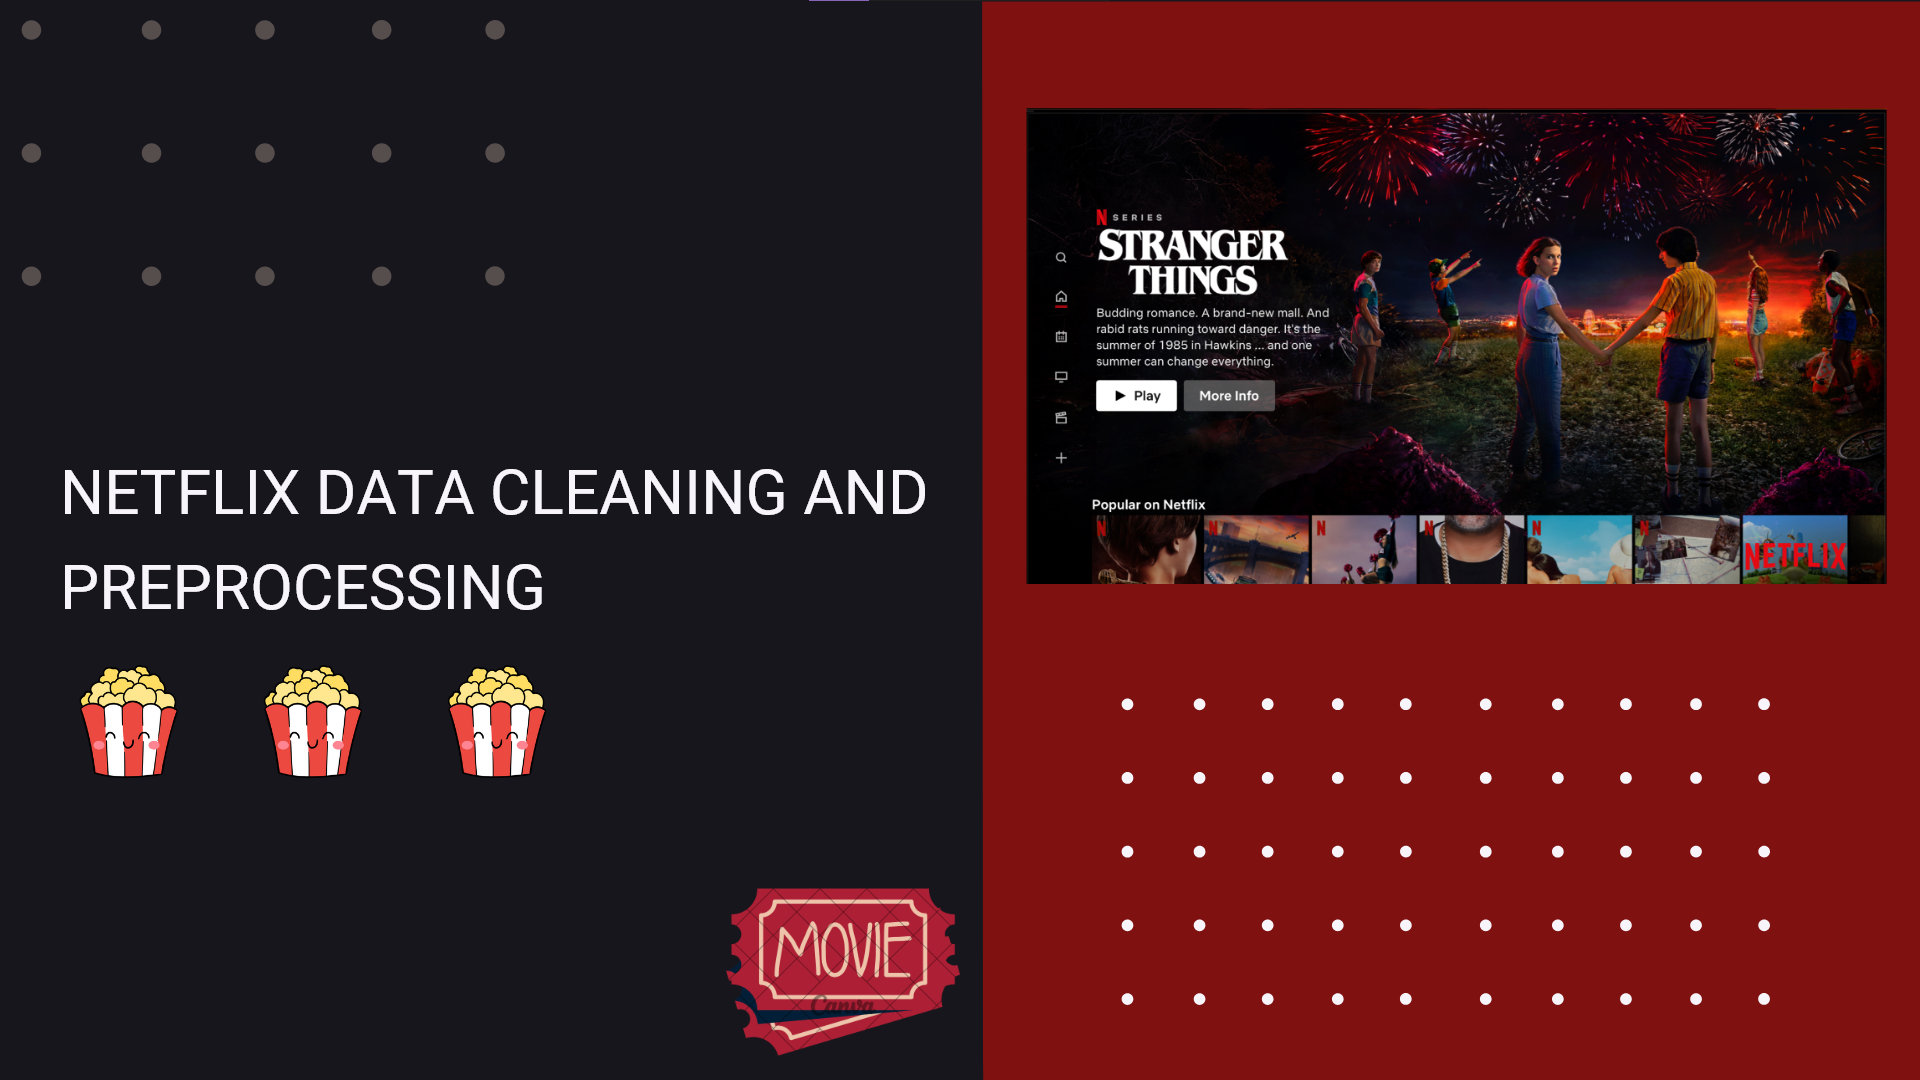
Utilized Python libraries such as Pandas and NumPy to extract, clean, and preprocess raw Netflix data, addressing messy data issues to ensure accuracy and readiness for analysis.
My work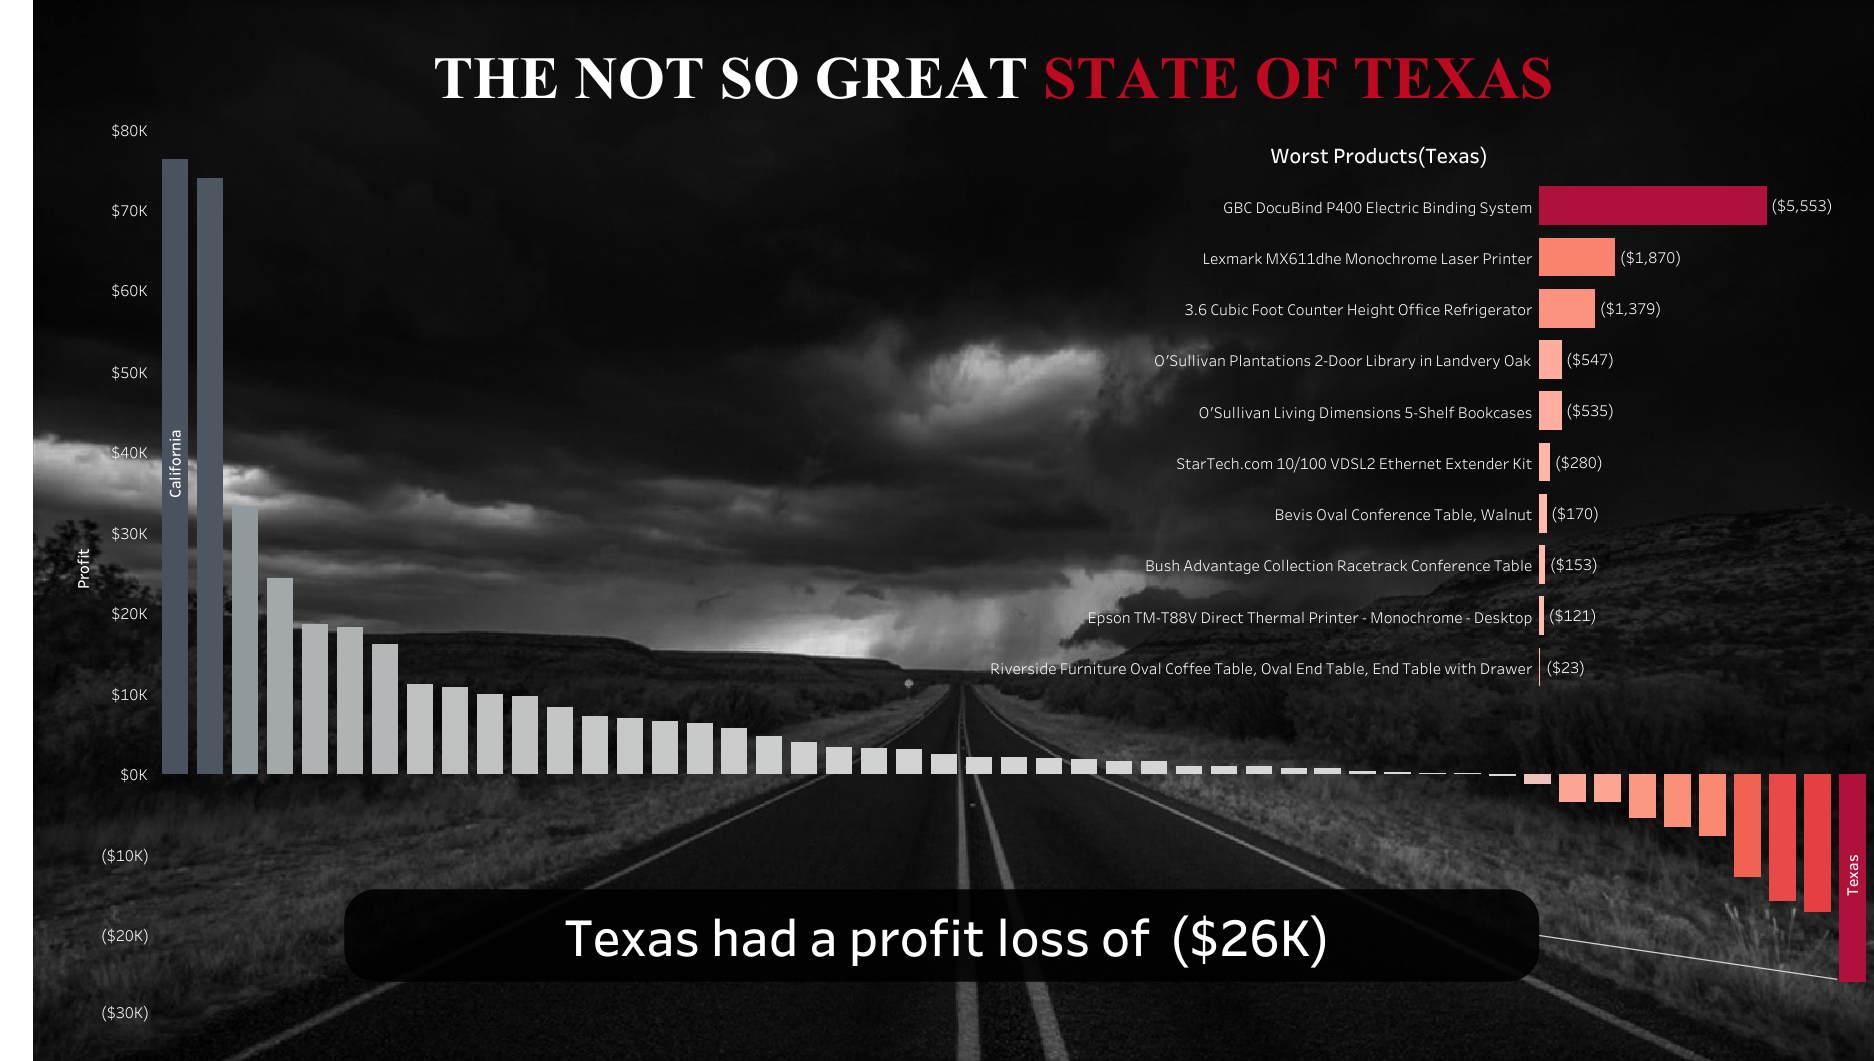
Performed extensive data analysis to deliver insights on how the company can increase its profits while minimizing losses. The interactive dashboard crafted using Tableau highlights one of the main issues at hand with a broader perspective for stakeholders. Also built interactive Story to assist Regional managers in making informed decisions.
My Work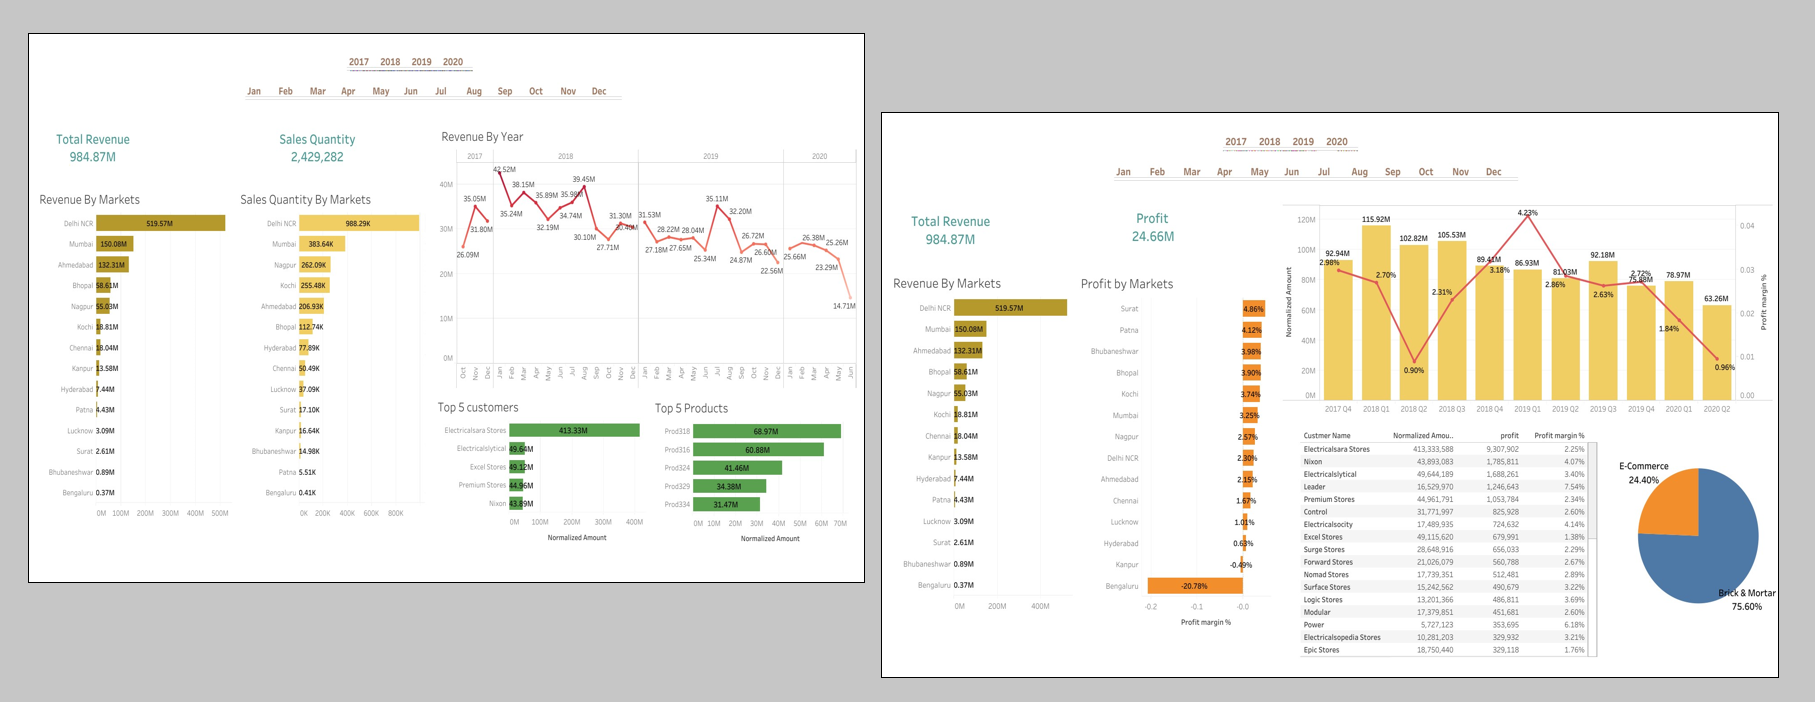
Crafted Revenue and Profit Analysis Dashboards using SQL & Tableau to analyze different parameters affecting company's performance year on year and to empower a hardware company in expanding its business into new regions, enabling data-driven insights crucial for strategic decision-making and growth planning.
My Work